The Energy Transition in 4 Charts

A peek at Wood Mackenzie’s latest outlooks for solar, wind energy storage and carbon emissions.
There is little debate that the energy transition is underway. However, the speed at which it is happening is very much in flux.
Wood Mackenzie recently compiled some of its latest power and renewables forecasts into a presentation (available here) that shows its most recent outlooks across sectors.
Here are a few of the highlights.
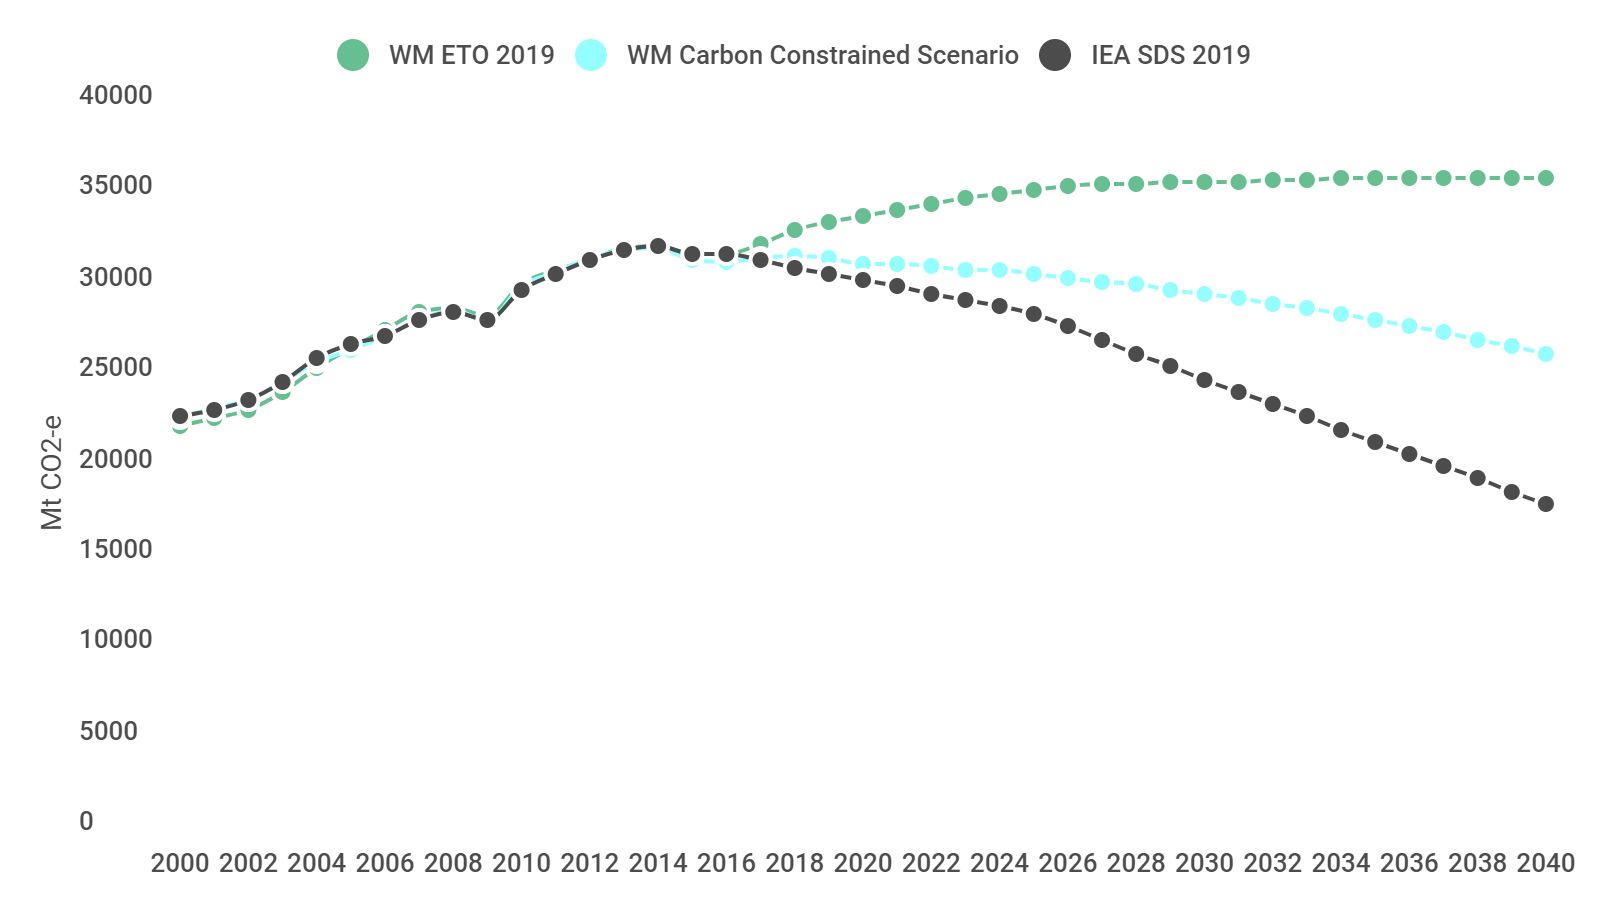
WoodMac’s analysts modeled a few different emissions scenarios in their latest Energy Transition Outlook. Even under an aggressive-action scenario, the outlook is dim for keeping global warming below 2° C, with emissions plateauing but not yet falling in the 2030s.
How Emissions Differ by Scenario, 2000-2040
Source: Wood Mackenzie’s Energy Transition Outlook
“The energy mix is changing only gradually, and the world risks relying on fossil fuels for decades to come,” Wood Mackenzie president Neal Anderson writes.
“Despite great efforts to reduce costs in renewables, electricity, zero-carbon technologies and advanced transportation — not to mention burgeoning support in governmental policies — it is not enough,” Anderson said.
“Our analysis sees carbon emissions continuing to rise into the 2020s, with growth slowing only in the 2030s. As a result, our Energy Transition Outlook (3° C) and Carbon-Constrained Scenario (2.5° C) fall outside the 2° C or lower trajectories.”
Solar
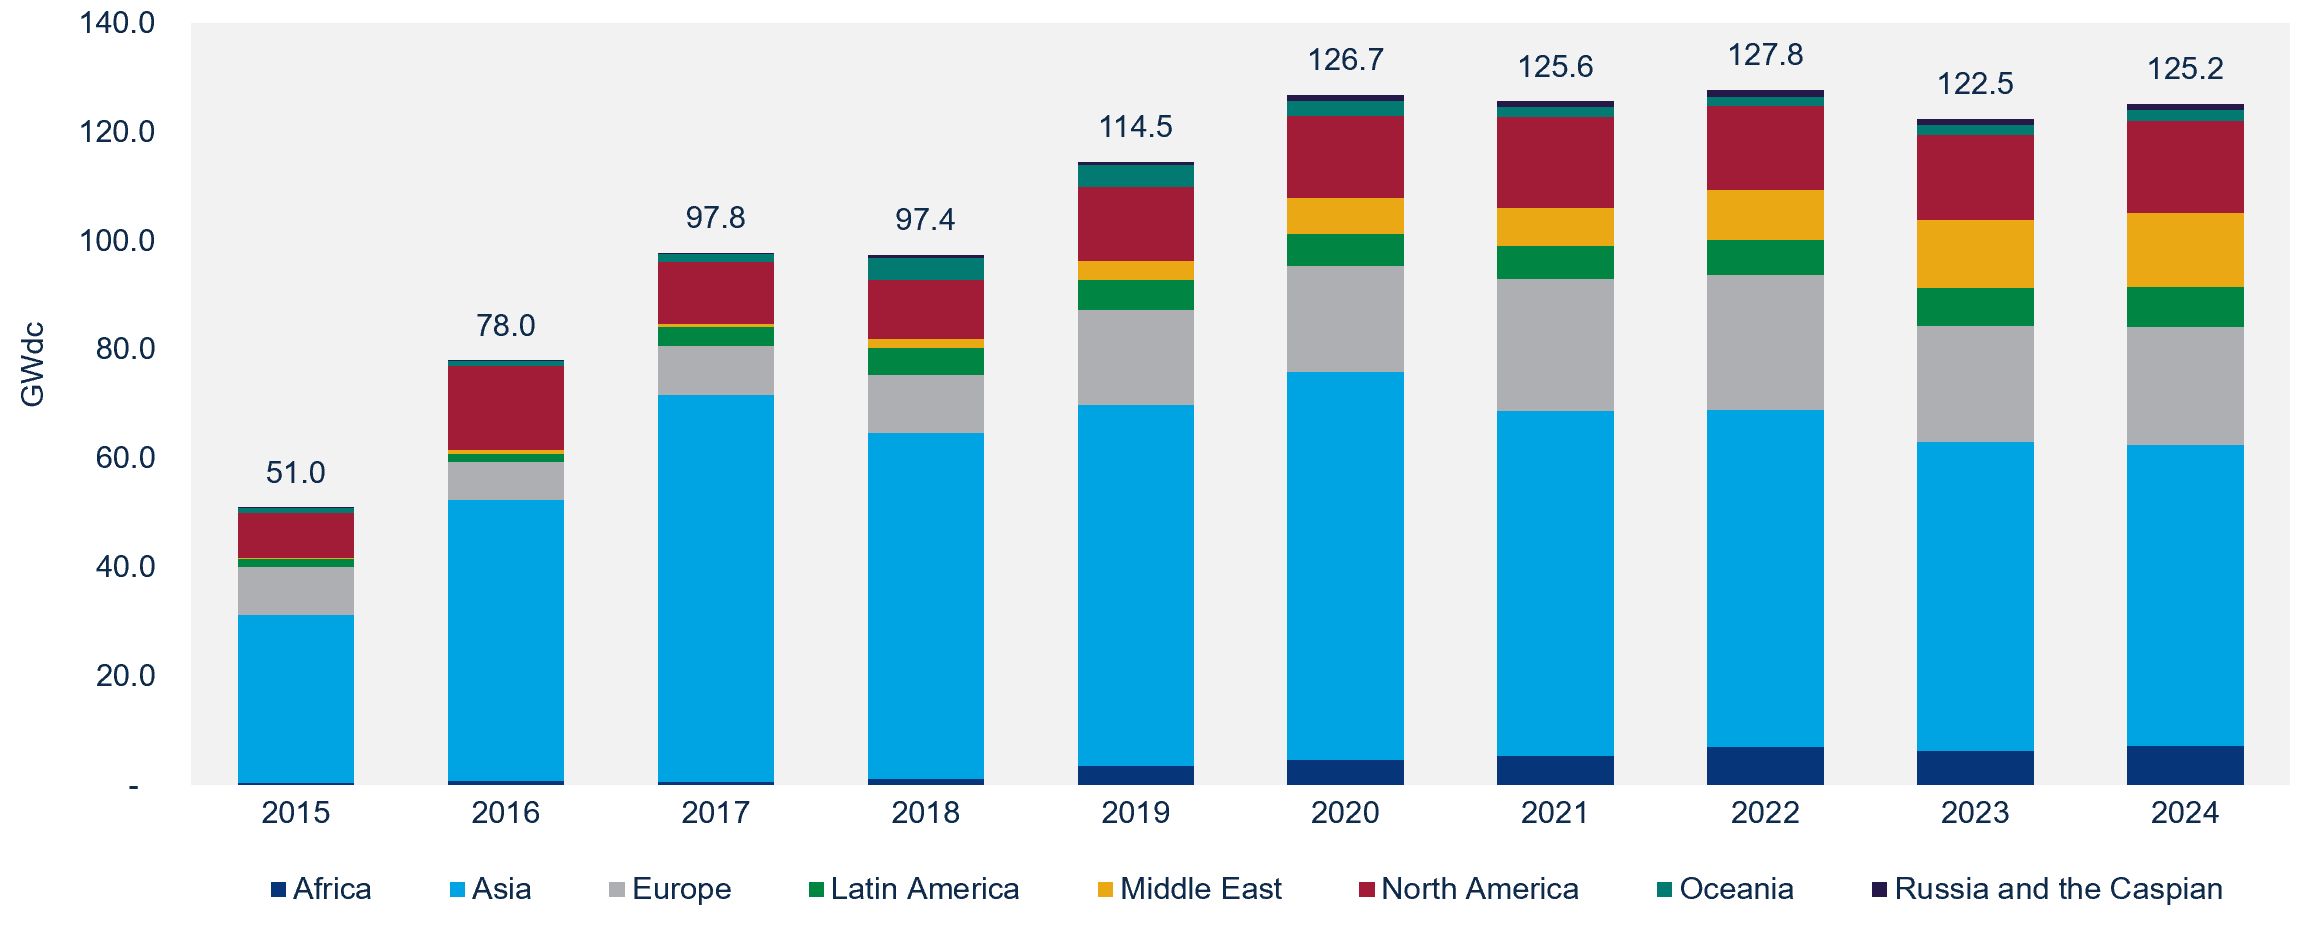
After its first down year in recent memory, the global solar market is poised for a rebound in 2019. However, Wood Mackenzie expects a relatively flat market between 2020 and 2024.
Annual PV Demand by Major Region, 2001-2024E
Source: Wood Mackenzie’s Global Solar Market Outlook Update, Q2 2019
Energy storage
The world saw immense gains in energy storage deployments in 2018, and Wood Mackenzie expects the trend to continue. According to the analysis, “The U.S. is the clear front-runner, making up 34 percent of deployed GWh capacity by 2024.” It continues, “China (driven by state-level mandates and policy), Japan, Australia and South Korea also lead the pack.”
Global Cumulative Deployment Capacity, 2013-2024E (GWh)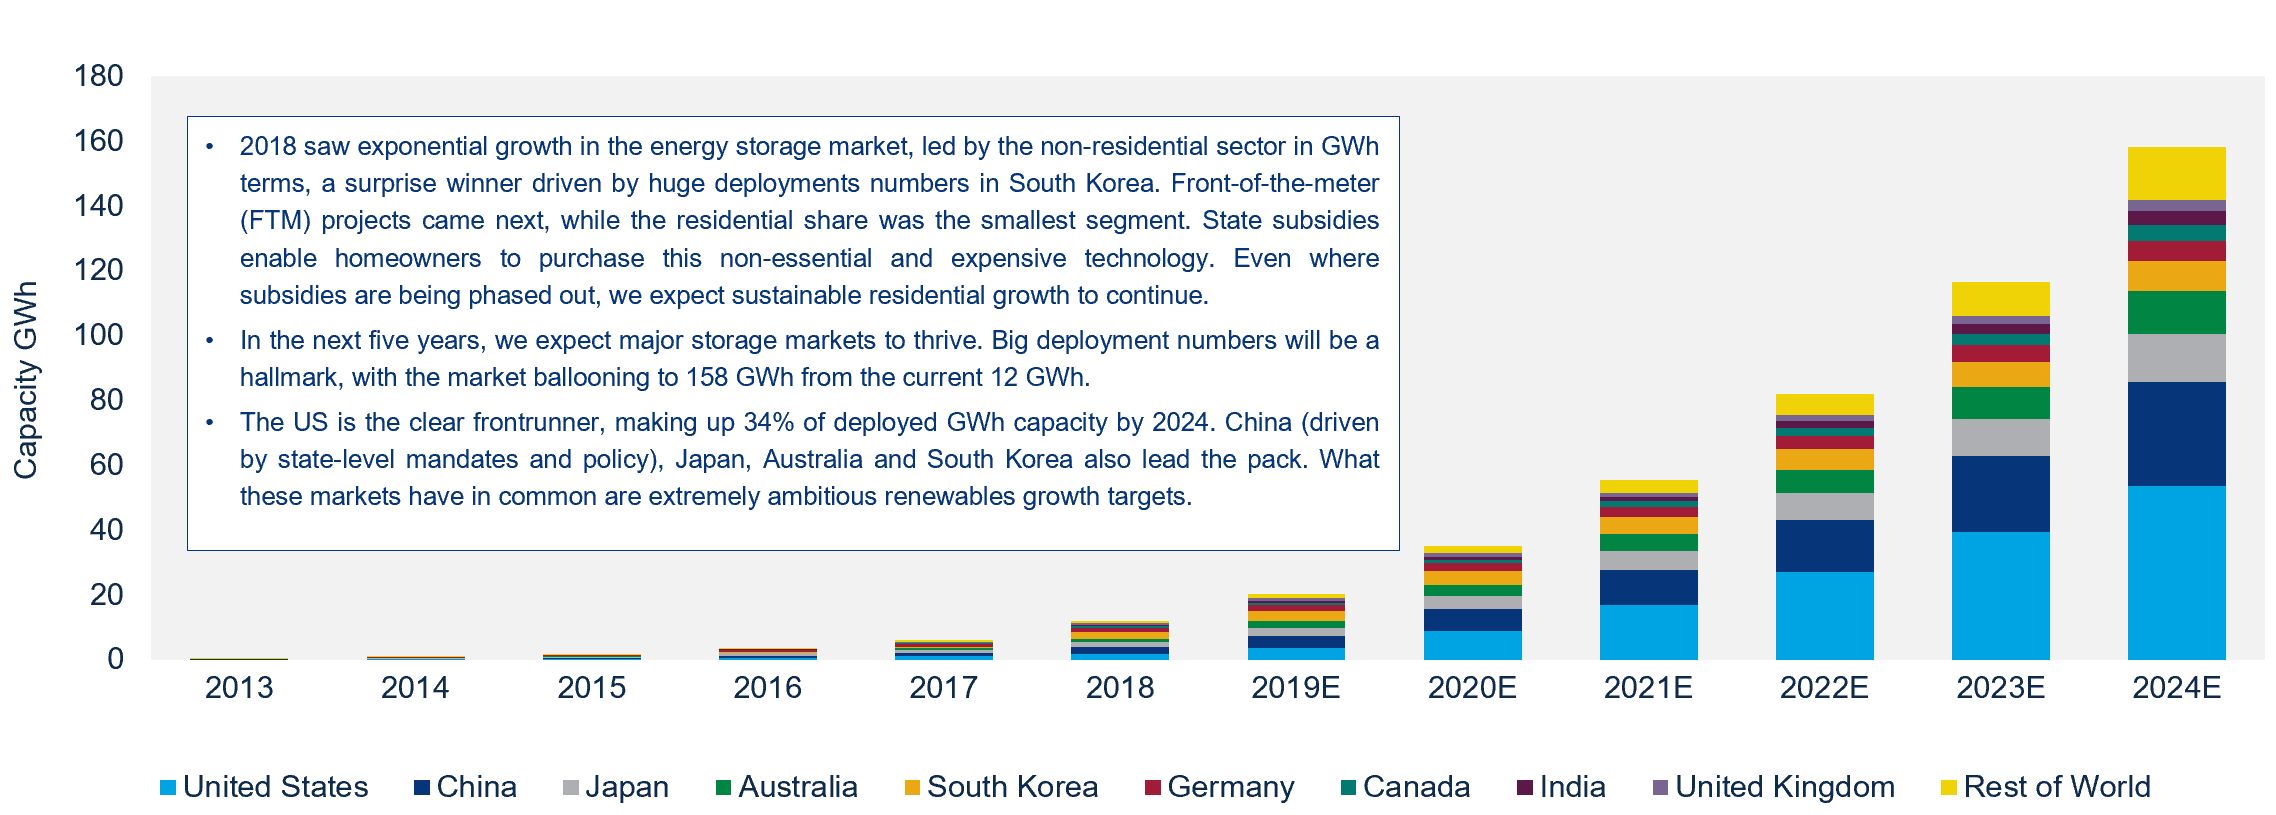
Source: Wood Mackenzie’s Global Energy Storage Outlook 2019
Wind power
On the wind front, WoodMac recently upgraded its forecast due in large part to new state-level targets and strengthening renewable portfolio standard mechanisms in the U.S.
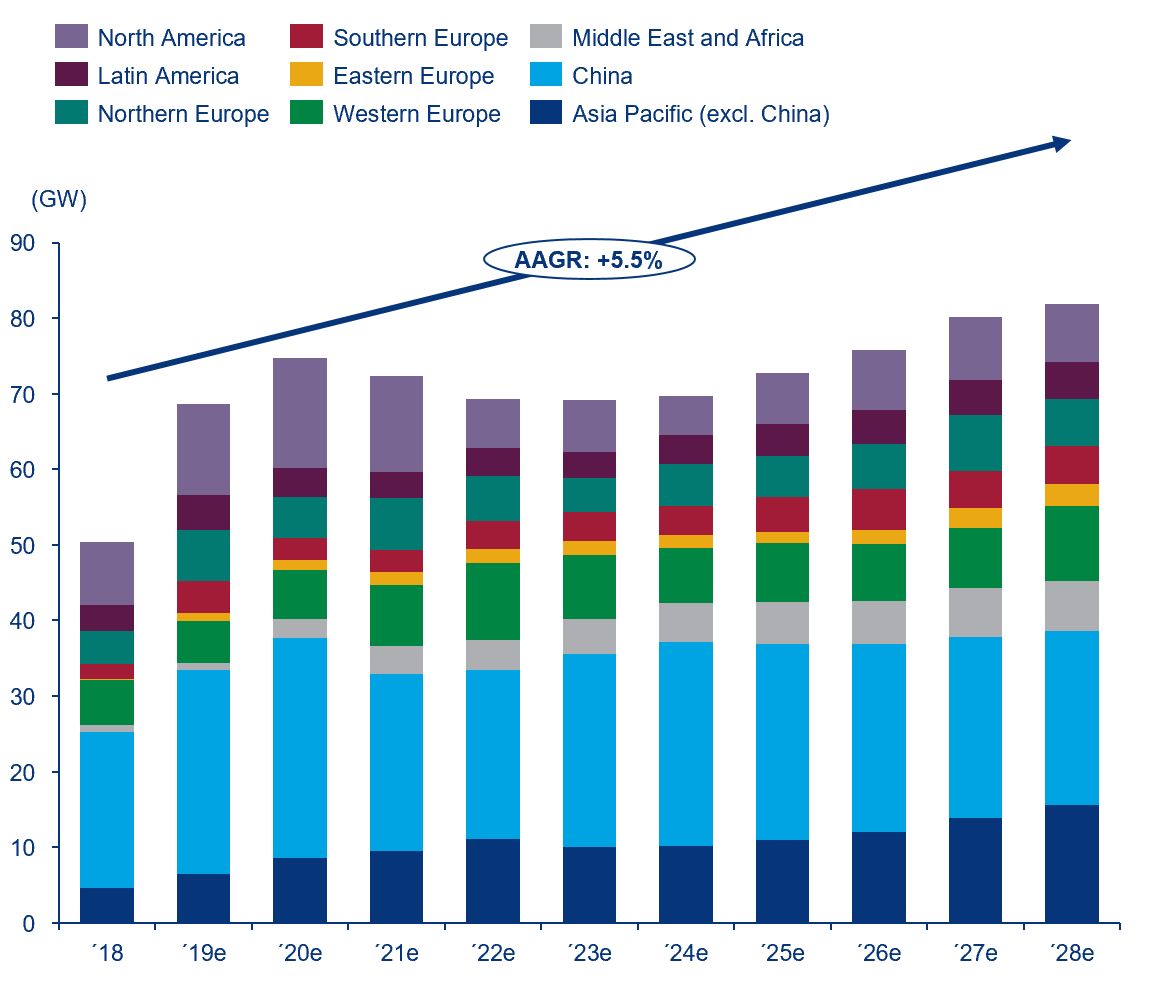
Source: Wood Mackenzie’s Global Wind Market Outlook Update, Q2 2019
The slide deck also has Wood Mackenzie’s latest outlooks on the U.S. utility-scale and residential solar markets, global advanced metering infrastructure, global EV sales, offshore wind operations and maintenance, and more. Wood Mackenzie has made it available for free here.
***
Join the Wood Mackenzie analyst team this year at Solar Power International. Stop by booth #7342 to meet with the team or demo our Data Hub.


